From Atoms to Analytical Answers
Matter at the Molecular Scale
Everything that can be measured, eaten, grown, processed, or tested is made of matter. And all matter — regardless of how complex it appears at the scale of human experience — is built from a surprisingly small set of ingredients.
Atoms are the fundamental building blocks of chemical matter. Each element in the periodic table is a distinct type of atom, defined by the number of protons in its nucleus. Carbon, hydrogen, oxygen, and nitrogen are the four atoms that make up the vast majority of biological and organic material — the food we eat, the soil we farm, the fuels we burn, and the tissues of living organisms.
Atoms rarely exist in isolation. They bond together to form molecules — stable arrangements in which atoms share electrons to achieve lower energy configurations. The covalent bond, in which two atoms share a pair of electrons, is the primary structural unit of organic chemistry. A single carbon atom can form four covalent bonds simultaneously, which is why carbon is the architectural backbone of biological molecules: it can link to other carbons in chains and rings while simultaneously bonding to hydrogen, oxygen, nitrogen, and other elements.
The spatial arrangement of these bonds determines the three-dimensional shape of a molecule, and that shape determines how the molecule behaves — chemically, biologically, and analytically.
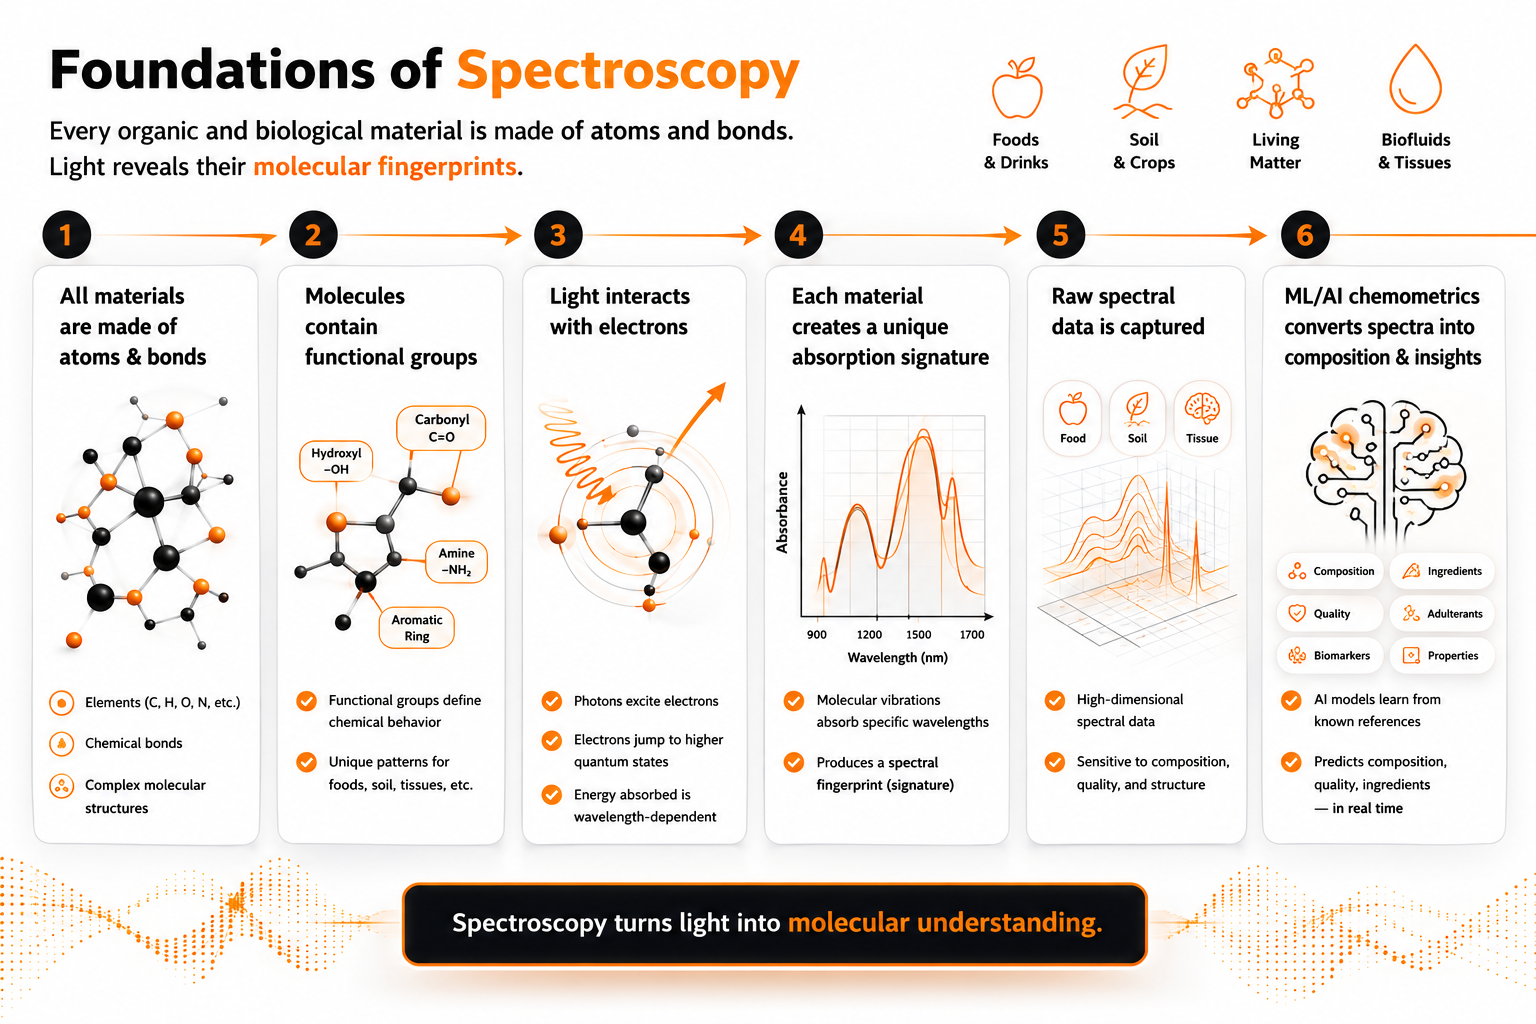
Functional groups are recurring structural units within molecules that confer characteristic chemical properties. A hydroxyl group (O-H) makes a molecule behave as an alcohol or contributes to water solubility. A carbonyl group (C=O) is the signature of fats, oils, and many flavour compounds. An amino group (N-H) is the defining feature of proteins and amino acids. These groups appear repeatedly across millions of chemically distinct molecules — and, as will become clear, they are precisely what near-infrared spectroscopy is sensitive to.
Light as an Analytical Tool
Light is electromagnetic radiation — a form of energy that propagates as oscillating electric and magnetic fields. What distinguishes different types of light from one another is wavelength: the physical distance between successive peaks of the oscillating field, typically measured in nanometres (nm) for the spectral regions relevant to analytical chemistry.
The electromagnetic spectrum spans an enormous range of wavelengths, from gamma rays at fractions of a nanometre to radio waves measured in metres. The narrow band of wavelengths visible to the human eye — roughly 400 to 700 nm — represents a tiny fraction of this range. Below 400 nm lies ultraviolet radiation. Above 700 nm lies the infrared, a broad region that extends from just beyond visible red light to wavelengths of several millimetres.
Wavelength and energy are inversely related: shorter wavelengths carry more energy per photon, longer wavelengths carry less. This relationship is not merely a physical curiosity — it determines which types of molecular events different regions of the spectrum can trigger.
Ultraviolet light carries enough energy to excite electrons between energy levels, which is why UV spectroscopy is sensitive to electronic structure. Mid-infrared light carries less energy and interacts primarily with the fundamental vibrational modes of molecular bonds. Near-infrared light, occupying the 700–2500 nm range, interacts with overtones and combinations of these vibrational modes — a distinction that will become important shortly.
Absorption and Quantum Transitions
Molecules do not interact with all wavelengths of light equally. They absorb light selectively — at specific wavelengths determined by their molecular structure — and transmit or reflect the rest. This selectivity is the analytical foundation of spectroscopy.
To understand why, it is necessary to think about molecular bonds not as static connections but as dynamic mechanical systems. A covalent bond between two atoms behaves, to a useful approximation, like a spring connecting two masses. The atoms vibrate relative to one another — stretching toward and away from each other along the bond axis, or bending at angles to it — at frequencies determined by the masses of the atoms and the stiffness of the bond.
Quantum mechanics imposes a constraint on these vibrations: the energy of a molecular vibration is not continuous but quantised. A bond can only vibrate at specific discrete energy levels, not at arbitrary intermediate values. When a photon of light strikes a molecule, it can be absorbed — but only if its energy matches exactly the gap between two of these quantised vibrational energy levels. If the photon’s energy does not correspond to an allowed transition, it passes through the molecule unabsorbed.
This is why molecules absorb light at specific wavelengths. Each type of bond — C-H, O-H, N-H, C=O — has characteristic vibrational frequencies, and therefore absorbs light at characteristic wavelengths. The pattern of absorption across a range of wavelengths is the molecule’s spectral fingerprint: a record of which energies it absorbed and how strongly.
Two types of vibrational motion are analytically important. Stretching involves periodic change in the distance between two bonded atoms along the bond axis — like two masses connected by a spring being pulled apart and released. Bending involves periodic change in the angle between three atoms — like the arms of a compass opening and closing. Different functional groups exhibit characteristic stretching and bending frequencies, which is why functional group identification is possible from spectroscopic measurement.
The Near-Infrared Region
The mid-infrared region (2500–25000 nm) contains the fundamental vibrational absorptions of most organic functional groups — the primary, strongest absorption events corresponding to the ground-state to first-excited-state quantum transition. This is why mid-infrared spectroscopy is a powerful tool for chemical identification and structural elucidation.
Near-infrared spectroscopy operates in the 700–2500 nm range, where something different occurs. At these shorter wavelengths and higher photon energies, molecules absorb at overtone and combination frequencies — weaker absorption events that correspond to simultaneous or multi-quantum vibrational transitions. An overtone occurs when a bond absorbs enough energy to jump not to the first excited vibrational state but to the second or third. A combination band occurs when two different vibrational modes are excited simultaneously by a single photon.
These overtone and combination absorptions are substantially weaker than fundamental mid-infrared absorptions — typically one to two orders of magnitude less intense. This apparent disadvantage is, in practice, an analytical advantage: the weaker absorptions mean that NIR light penetrates much further into a sample before being fully absorbed, enabling measurement of solid, powder, and liquid samples without grinding, dissolution, or other destructive preparation.
The bonds that dominate NIR spectra are those involving hydrogen: C-H, O-H, and N-H stretches and their overtones and combinations. This is not a coincidence — hydrogen is the lightest atom, and light atoms vibrate at higher frequencies, shifting their overtone absorptions into the NIR window. Carbon-hydrogen bonds are ubiquitous in organic molecules. Oxygen-hydrogen bonds define water, alcohols, and carboxylic acids. Nitrogen-hydrogen bonds are the signature of proteins and amino acids.
The practical consequence is that near-infrared spectroscopy is exquisitely sensitive to the composition of organic matter — fat, protein, moisture, carbohydrates, and their constituent functional groups — across solid, powder, and liquid sample matrices, without sample preparation, without reagents, and without destroying the sample.
From Spectrum to Composition
When a near-infrared spectrometer illuminates a sample, it measures how much light is absorbed at each wavelength across the NIR range. The result is an absorption spectrum — a plot of absorbance against wavelength that encodes, in its shape and intensity, information about the chemical composition of the sample.
In principle, this spectrum could be read directly: identify the absorption peaks, assign them to known functional groups, and calculate concentrations from the Beer-Lambert law. In practice, this approach faces a fundamental obstacle. Real samples — food matrices, agricultural materials, industrial process streams — are chemically complex. Their NIR spectra are not collections of sharp, isolated peaks but broad, heavily overlapping absorption bands from dozens or hundreds of chemical constituents simultaneously. No human analyst, and no simple peak-picking algorithm, can reliably decompose this complexity into quantitative composition information.
This is the problem that chemometrics was developed to solve.
Chemometrics: Making Sense of the Spectrum
Chemometrics is the application of mathematical and statistical methods to chemical measurement data. In the context of NIR spectroscopy, its central task is calibration: building a quantitative model that relates spectral measurements to known composition values, so that the model can subsequently predict composition from spectra alone.
The calibration process begins with a training set — a collection of samples whose spectra have been measured by the NIR instrument and whose composition has been independently determined by reference analysis (wet chemistry, chromatography, or other validated methods). Each sample in the training set provides a paired data point: a spectrum and a reference value.
A chemometric model learns the relationship between spectra and reference values from this training set. The simplest and most widely used approach is Partial Least Squares (PLS) regression, which identifies the linear combinations of spectral variables — weighted combinations of absorbance values at different wavelengths — that best predict the reference values. These weighted combinations, called latent variables or PLS components, capture the chemically meaningful variation in the spectra while discarding measurement noise and irrelevant spectral features.
Once calibrated, the model can predict the composition of new, unknown samples from their spectra alone — without reference analysis, without wet chemistry, and without laboratory delay. The prediction takes the form of a numerical estimate of the analyte concentration, accompanied by a statistical uncertainty that quantifies how confident the model is in its answer.
Model performance is evaluated on validation samples — samples not used in calibration — using metrics such as the Root Mean Square Error of Prediction (RMSEP), which measures the average difference between predicted and reference values across the validation set. A well-calibrated model with low RMSEP on a representative validation set is a reliable analytical tool.
The quality of a chemometric model depends fundamentally on the quality and representativeness of the calibration data. A model trained on samples from a narrow range of compositions, measurement conditions, or sample origins will perform poorly on samples that fall outside that range. Building a robust calibration requires careful experimental design, diverse and representative sampling, and ongoing validation as the measurement context evolves — which is why calibration is a service, not a one-time setup.
The Complete Analytical Workflow
With the underlying science established, the complete NIR analytical workflow can be traced from sample to decision.
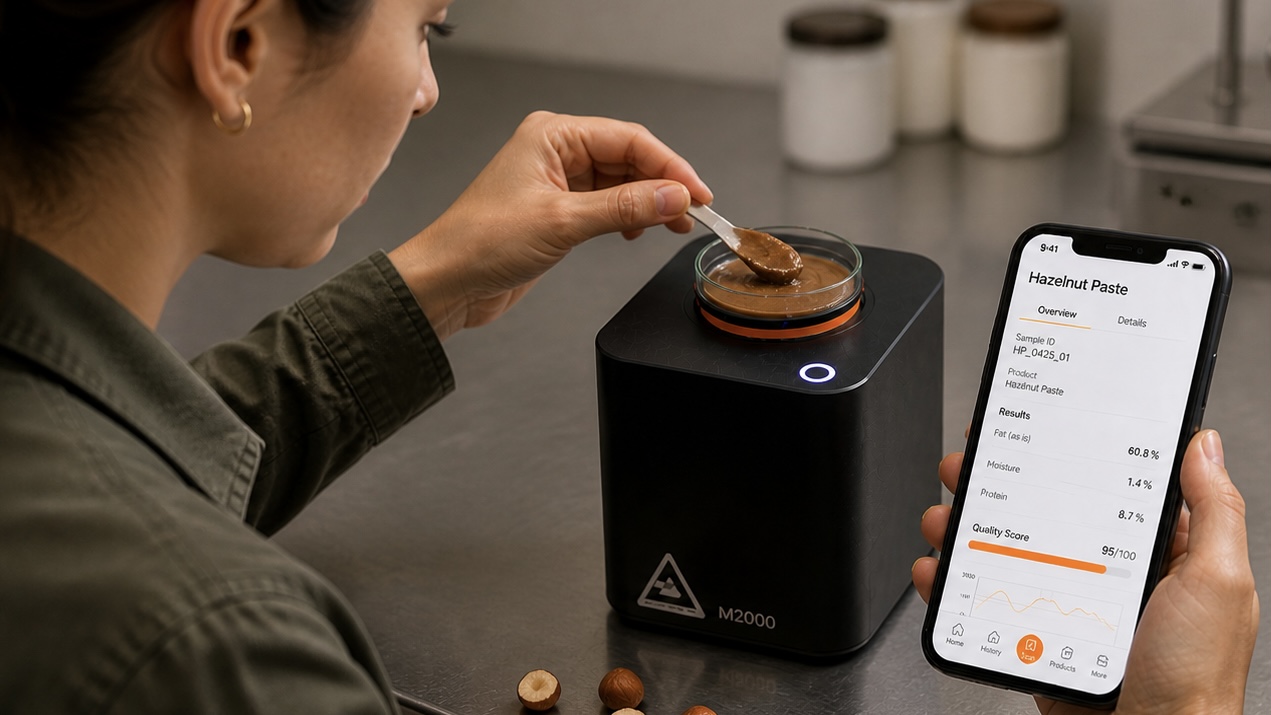
A sample — a food ingredient, an agricultural material, an industrial process stream — is placed in or presented to the NIR analyser. No grinding, dissolution, or chemical treatment is required. The analyser illuminates the sample with a broadband near-infrared light source and measures the intensity of light returned from or transmitted through the sample at each wavelength across the NIR range.
The raw detector output is processed into an absorption spectrum — corrected for instrument response, background, and any systematic measurement artefacts — that represents the sample’s characteristic NIR fingerprint.
The spectrum is passed to the chemometric model, which applies the calibration relationship learned from the training set to generate a composition prediction: fat content, protein concentration, moisture level, or any other analyte for which a validated calibration exists. The prediction is returned with a statistical uncertainty estimate and flagged if the spectrum falls outside the range of the calibration model.
The composition prediction is logged, timestamped, and transmitted to the cloud analytics platform, where it joins the accumulated measurement history for that sample type, production line, or field location. Dashboard-ready reports are generated automatically and made accessible to QC teams, production managers, and other stakeholders from any mobile or desktop device.
The decision — release or reject a batch, accept or return a delivery, adjust a process parameter, flag a sample for secondary testing — is made on the basis of real composition data, at the point of measurement, without laboratory delay.
From atom to answer, in seconds.
What Comes Next
This article has introduced the scientific foundations of near-infrared spectroscopy — the molecular physics that makes it work, the chemometric mathematics that makes it quantitative, and the analytical workflow that makes it useful. It is the first module in the Altum NIR Academy, a structured educational resource for teams deploying NIR spectroscopy for the first time.
Subsequent modules will go deeper into calibration design and validation, the mathematics of PLS and chemistry-informed machine learning, instrument qualification and method transfer, and application-specific guidance for food, agriculture, and industrial deployments.